Upload
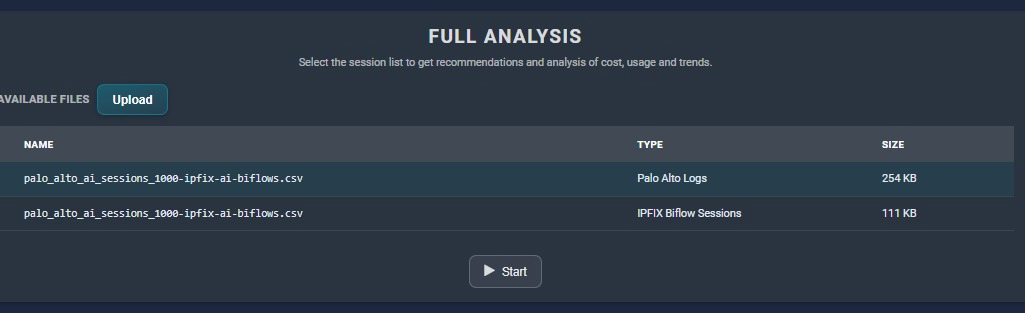
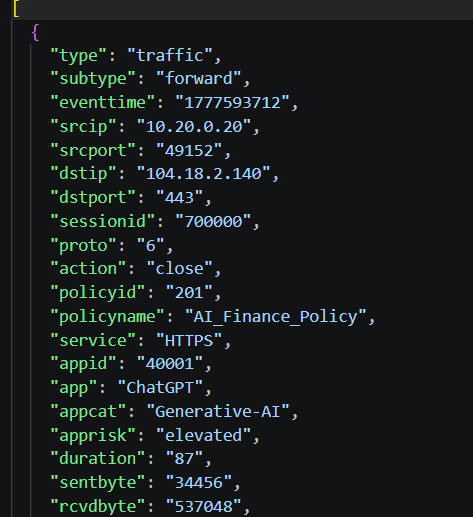
Input
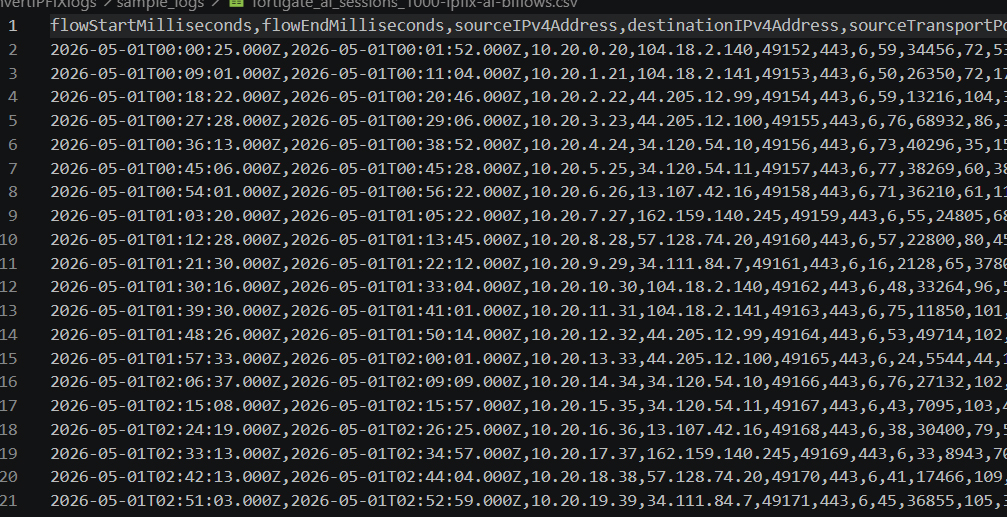
Output
This guide covers:
The companion converter is:
fortigate_ai_to_ipfix.py
The converter maps FortiGate traffic-log fields into these IPFIX-style biflow columns:
flowStartMillisecondsflowEndMillisecondssourceIPv4AddressdestinationIPv4AddresssourceTransportPortdestinationTransportPortprotocolIdentifierpacketDeltaCountoctetDeltaCountreversePacketDeltaCountreverseOctetDeltaCountIt uses these FortiGate fields when present:
eventtimedurationsrcip, dstipsrcport, dstportprotosentbyte, rcvdbytesentpkt, rcvdpktsessionidapp, appcat, appriskapplistsaasnamesrcuserpolicyname, policyidFortinet’s log reference documents these fields on forward traffic logs, including eventtime, duration, sessionid, sentbyte, rcvdbyte, sentpkt, rcvdpkt, app, appcat, applist, and saasname.
For AI observability on FortiGate, the cleanest path is:
Fortinet documents that policy logging is controlled by the Log Allowed Traffic setting.
For accepted traffic, the key choices are:
Security EventsAll Sessions
For AI-session capture, All Sessions is the safer choice because it gives complete allowed-session logging instead of only security-profile hits.
Fortinet also notes that all security-profile-related logs are tracked within the Traffic logs.
FortiGate supports these logging modes:
per-session – two log messages per session, one at establishment and one at the endper-session-ending – one log message at the end, including session duration
For biflow conversion, per-session-ending is often the better default because it produces fewer records while still including the duration needed to infer session start time.
If you need both start and end visibility, use per-session.
Application Control can recognize a large number of applications and requires an Application Control sensor attached to the firewall policy.
Recommended AI observability pattern:
Monitor where visibility is needed without blocking.
Fortinet states that Monitor passes the traffic and generates a log message, while Allow passes the traffic without generating a log message.
Deep inspection decrypts, inspects, and re-encrypts encrypted traffic.
This is important for browser-based AI tools and AI APIs because application identification and domain visibility are weaker without decryption.
If full decryption is not possible, Traffic logs still provide useful session metrics, but application labeling may be less reliable.
FortiGate can store logs locally or send them to:
Syslog can be exported in CSV and CEF formats.
CLI example for FortiAnalyzer:
config log fortianalyzer setting
    set status enable
    set server <server_IP>
    set upload option realtime
end
CLI example for syslog:
config log syslogd setting
    set status enable
    set server <syslog_IP>
end
Recommended deployment model:
Log Allowed Traffic to All Sessions.Monitor.
This helps capture app, appcat, applist, saasname, user, policy, and directional byte counters together.
The converter primarily looks at:
appappcatapplistsaasnamehostnameurldomainIf logs contain recognizable AI app names or SaaS names, detection becomes more reliable.
If the application field is generic, the converter falls back to URL and hostname clues.
FortiGate raw key-value syslog:
python .\fortigate_ai_to_ipfix.py .\fortigate.log
FortiGate JSON export:
python .\fortigate_ai_to_ipfix.py .\fortigate.json
Add extra AI keywords:
python .\fortigate_ai_to_ipfix.py .\fortigate.log --keyword "vertex ai" --keyword "azure-openai"
Keep all traffic sessions:
python .\fortigate_ai_to_ipfix.py .\fortigate.log --include-non-ai
All Sessions logging produces more volume than Security Events.per-session-ending is usually enough for biflow analytics but does not provide a distinct session-start log.app, appcat, saasname, or host/domain context, AI classification becomes weaker.